2020 Election Review: Smaller, Economically Successful Midwest Cities Shifted Toward Biden as Much as Suburbs

Data from the 2016 and 2020 elections show it’s not just large cities, their suburbs, and university towns that have shifted toward Democrats.
Midwest cities are not all the same, and each tells a story of the ongoing economic shift within the region. In turn, a city’s economic well-being reflects its political leanings.
President Biden’s rebuilding of the “Blue Wall” was due not only to greater margins in large cities and their suburbs, but also to gains in economically successful, small and mid-sized cities sprinkled across the Midwest. Shifting voting behavior in these communities explains Biden’s electoral college win—and the region’s changing politics—as powerfully as other trends.
The Democrats’ Urban Advantage and Exceptions to the Rule
Democrats continue to enjoy political advantages in most urban areas, including in the Midwest. As Figure 1 demonstrates, Biden won counties home to major cities (cities with a population greater than 300,000) by larger margins than 2016, made suburban counties (higher population counties adjacent to “major city” counties) much more competitive, and dominated counties with large college towns like Ann Arbor and Madison. This contrasts with the scores of rural Midwest counties that broke for Trump by similar or greater margins than 2016.
Figure 1: Party Voting Share by Urban County Type
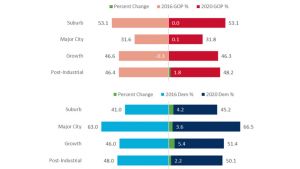
Source: MIT Election Lab | New York Times
Yet another group of communities in the region have divergent politically trajectories: small and mid-sized cities, which split between struggling, post-industrial communities, and cities succeeding in today’s economy. This latter group of “growth” counties, similar in size yet distinct from their post-industrial peers, shifted significantly toward the Democrats in 2020.
In these cities (Figure 2), county-level data of final 2020 vote margins demonstrates that Biden outperformed Clinton’s 2016 showing by over 5 points on average (46.0% to 51.4%), while Trump’s performance, having still won several of these counties outright, slightly decreased (46.6% to 46.3%).
Figure 2: Party Voting Share 2016 - 2020 in Growth Counties
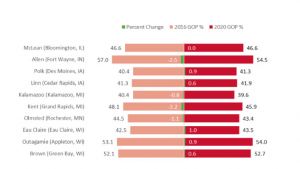
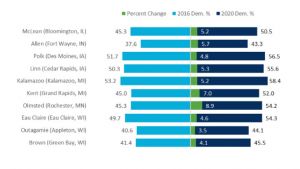
Source: MIT Election Lab | New York Times
What Sets Economically Successful Cities Apart?
These cities are distinct because they are home to economies built around dynamic and growing business sectors, such as healthcare, insurance, and high-end manufacturing. Large companies or business clusters spur on economic activity, contributing to higher median household income levels than the state average (Figure 3), and significantly higher than post-industrial cities. This is also reflected in county-level unemployment rates, which on average run almost 9% below their state levels, offering residents better opportunities and more stable incomes.
Figure 3
| County | % of State Median HH Income | % of State Unemployment Rate |
|---|---|---|
| McLean (Bloomington, IL) | 100.0% | 95.0% |
| Allen (Fort Wayne, IN) | 98.6% | 93.9% |
| Polk (Des Moines, IA) | 108.9% | 103.7% |
| Linn (Cedar Rapids, IA) | 104.8% | 107.4% |
| Kalamazoo (Kalamazoo, MI) | 95.3% | 80.5% |
| Kent (Grand Rapids, MI) | 111.8% | 70.7% |
| Olmsted (Rochester, MN) | 108.2% | 81.3% |
| Eau Claire (Eau Claire, WI) | 101.2% | 93.9% |
| Outagamie (Appleton, WI) | 104.4% | 90.9% |
| Brown (Green Bay, WI) | 102.1% | 93.9% |
| Average of Growth Counties | 103.5% | 91.1% |
2019 Data: BLS and Economic Research Service (USDA)
Conversely, struggling post-industrial communities hold median household income levels 10% below their state average, and stake unemployment rates about 20% higher than their states overall (Figure 4).
Figure 4
| County | % of State Median HH Income | % of State Unemployment Rate |
|---|---|---|
| Macon (Decatur, IL) | 75.5% | 132.5% |
| Rock Island (Moline, IL) | 83.5% | 122.5% |
| Delaware (Muncie, IN) | 79.7% | 118.2% |
| Scott (Davenport, IA) | 106.3% | 122.2% |
| Genesee (Flint, MI) | 84.9% | 119.5% |
| Lucas (Toledo, OH) | 85.0% | 114.6% |
| Mahoning (Youngstown, OH) | 81.8% | 139.0% |
| Montgomery (Dayton, OH) | 93.2% | 102.4% |
| Summit (Akron, OH) | 98.4% | 119.5% |
| Erie (Erie, PA) | 81.8% | 104.5% |
| Kenosha (Kenosha, WI) | 103.6% | 121.2% |
| Racine (Racine, WI) | 96.1% | 124.2% |
| Rock (Janesville, WI) | 96.0% | 112.1% |
| Average of Post-Industrial Counties | 89.7% | 119.4% |
2019 Data: BLS and Economic Research Service (USDA)
In November, Trump nearly matched his 2016 showing in post-industrial cities (Figure 5) that were once strong union and Democratic strongholds, and as recently as 2012 went for Democrats by an average of 15.2 points (56.9% to 41.7%).
Figure 5: Party Voting Share 2016 - 2020 in Post-Industrial Counties
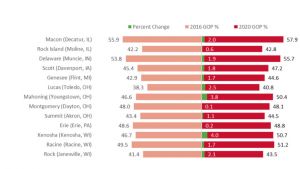
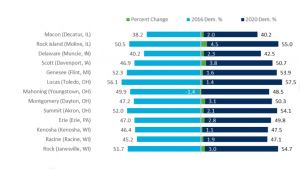
Source: MIT Election Lab | New York Times
Shifting Economic Prospects Presage Deeper Division
While the political geography of the Midwest has shifted drastically in the past several elections, it is far from fixed. Growing political divides carry a warning to the Biden administration and new Congress to not overlook the widening inequality between economically advantaged Midwestern cities and metros, and struggling post-industrial and rural communities.
To ensure that an uneven, post-COVID-19 recovery and further economic divergence—and political division—does not entrench itself, narrowing the gap between communities succeeding and struggling must take center stage in any economic recovery package emanating from Washington.